You converted a 40-page financial report from PDF to Word. The text came through cleanly. The tables did not. Column widths shifted. A two-row header collapsed into one. Numbers from column three landed inside column four, with no border to mark the boundary. Five tables out of nine looked unusable. The other four needed editing you could not finish before the deadline.
Searching for how to convert PDF with tables to Word returns the same advice everywhere: try a different converter. The advice is incomplete. Tables fail in conversion for at least five distinct reasons, and each reason has a specific signature, a predictable behavior, and a fix path that matches its complexity. Switching tools without understanding which type of table you have wastes hours. Diagnosis takes ninety seconds. The fix that follows takes between five minutes and four hours, depending on what you found.
This guide maps the diagnostic. Read it before you convert PDF with tables to Word, and you will know which path to take before you open any tool. For the wider PDF-to-Word picture, see our main PDF-to-Word guide. For general formatting failures beyond tables (fonts, columns, headers), see our diagnostic guide on formatting preservation. If your PDF is scanned rather than digital, the rules differ – see our scanned PDF conversion guide. Here we focus on tables in digital PDFs, where the text is selectable but the table structure breaks anyway.
Why PDF Tables Break in Conversion
To convert PDF with tables to Word reliably, you first have to understand why the tables break in the first place. PDF and Word disagree fundamentally about what a table is. PDF stores a page as a fixed canvas: each character lands at a specific coordinate, each line of the grid is drawn as an independent visual element, each cell exists as a region of the page rather than a structured object. The table you see on screen is a collection of separate strokes and text positions, not a table data structure. Word does the opposite. A Word table is a semantic object: rows know they are rows, cells know which column they belong to, the structure carries meaning even when the visual rendering changes.
When a converter reads a PDF and writes a .docx file, it has to reverse-engineer the structure from the visual layout. It looks for ruling lines, evenly spaced text positions, and rectangular regions, then guesses where the rows and columns are. The guess succeeds on simple tables. It fails on complex ones, predictably, in five distinct ways.
Microsoft’s own documentation on opening PDFs in Word warns that PDF stores where elements sit on the page, not the relationships among them, so the converted Word file may not match the original. Adobe’s own conversion guide recommends manual review after every conversion. ABBYY’s table-recognition documentation walks through the parameters and edge cases that determine whether a table survives. Better tools shrink the gap; no tool eliminates it.
The realistic range: a simple bordered table with selectable text converts at near-perfect fidelity in any decent tool. A financial report with merged headers, banded rows, footnoted cells, and three pages of continuation loses 30 to 60 percent of its structure on every conversion, regardless of tool. Knowing which case you have is the first decision.
Diagnose Your Table Type in Ninety Seconds
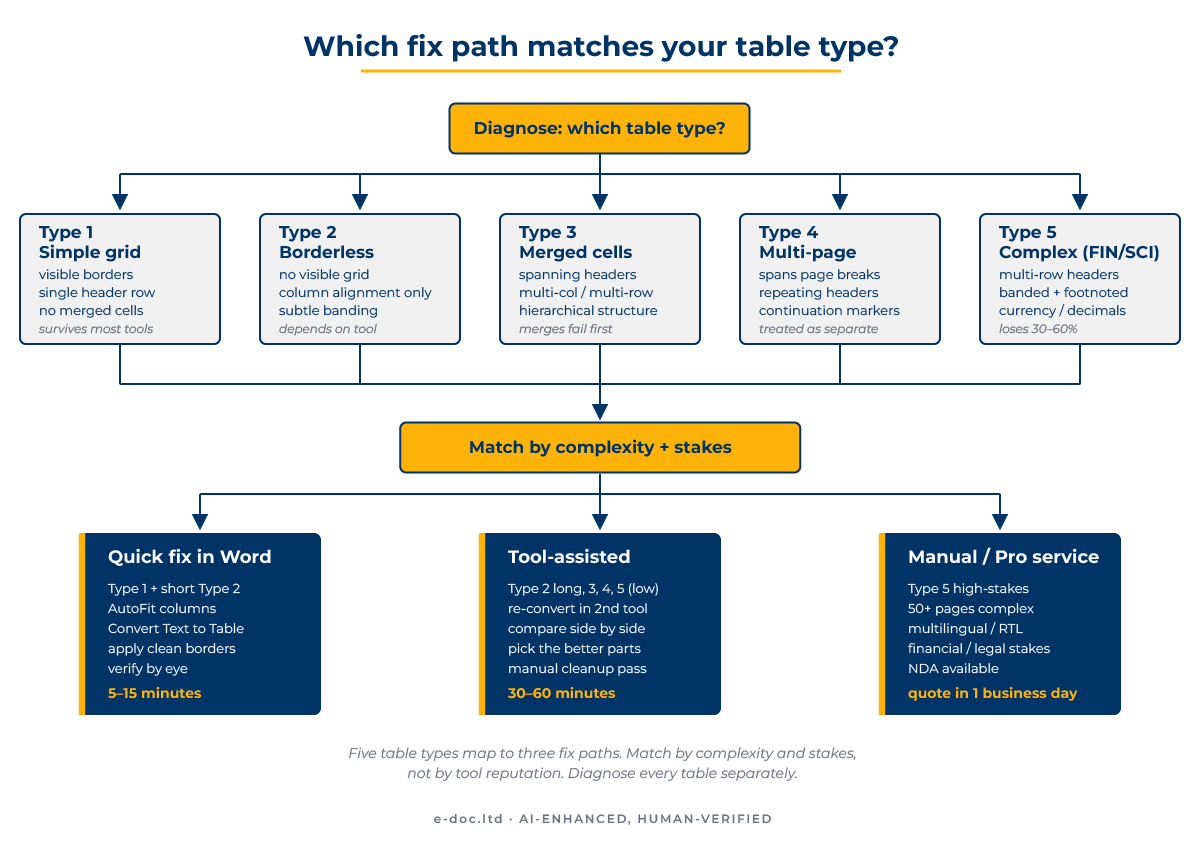
Five table types cover almost every PDF in circulation. Identify yours before reaching for any tool, and the rest of the work falls into place.
Type 1: Simple bordered grid
Visible borders on every cell. Single-row header. No merged cells. Each cell holds plain text or a single number. Common in basic data tables, simple price lists, contact directories, and small reference grids. The visual signature: every cell looks like a rectangle, the lines are visible, the structure is obvious to the eye.
Type 2: Borderless or minimal-border
Tables that depend on column alignment, white space, or subtle banding rather than visible lines. Common in marketing collateral, magazine layouts, modern brand-aligned reports, and any document where designers prioritized visual lightness. The visual signature: the table looks like a table to a human reader, but no obvious grid lines mark the cells. Selecting text often spans columns in unexpected ways because the converter cannot find the grid.
Type 3: Merged cells and spanning headers
One or more cells span two or more columns or rows. Header rows often span groups of columns (“Q1 / Q2 / Q3 / Q4” sitting under a single “2025” header that covers all four). Common in pivot-style summaries, financial statements, comparison matrices, and survey result tables. The visual signature: at least one cell is wider or taller than the cells around it, and the header carries hierarchical meaning that depends on the merge.
Type 4: Multi-page tables with repeating headers
One table that breaks across two or more pages, with the header row repeated at the top of each continuation. Common in long contracts, regulatory filings, financial schedules, and academic data appendices. The visual signature: a “continued” marker, a repeated header row, or a footer line that acknowledges the break. The structural challenge: the converter has to recognize that the second page belongs to the same table as the first, not to a new one that happens to start with similar text.
Type 5: Financial or scientific complex
Multi-row headers, banded rows for readability, footnoted cells with superscript numerals or symbols, parenthesized negative numbers, currency-aligned decimals, sub-totals and totals nested inside the table body. Common in annual reports, scientific papers, regulatory financial statements, and any document where the table is itself the central content. The visual signature: dense numbers, multiple visual conventions stacked together, footnote markers tied to specific cells.
Most documents you handle in real work mix two or three of these types in the same file. A research paper might have one borderless reference table (Type 2), one comparison matrix with merged headers (Type 3), and one financial summary with footnotes (Type 5). Diagnose every table separately, not the document as a whole.
What Each Type Does in Conversion
Once you know the type, the failure profile is predictable. Knowing what to expect saves the time you would otherwise spend wondering whether the tool is broken.
Type 1 (simple bordered grid)
Survives almost any conversion at high fidelity. Word’s built-in PDF import, Adobe Acrobat, ABBYY FineReader, and most online tools all handle Type 1 reliably. Borders may shift slightly, column widths may change, but the data lands in the right cells. Cleanup time after conversion: under five minutes.
Type 2 (borderless or minimal-border)
Fails in ways that depend on the tool. Word’s built-in import frequently produces a long single-column flow with text from each row separated by tabs but no table structure. Adobe Acrobat detects the column boundaries about half the time. ABBYY FineReader detects them more reliably because it lets you draw the grid manually before recognition. The data is usually intact; the structure has to be rebuilt. Cleanup time: ten to thirty minutes per table.
Type 3 (merged cells and spanning headers)
The merge fails first. The converter splits merged cells into separate cells with the original content placed in only one of them, leaving the others empty. Spanning headers collapse into a single cell or vanish entirely. The data rows often survive, but the header that gave them meaning no longer connects to them. Reconstruction requires rebuilding the merge manually. Cleanup time: fifteen to forty-five minutes per table, more if you have to look up the original document to remember what the merges meant.
Type 4 (multi-page tables)
The converter usually treats each page as a separate table. The “continued” cue and the repeated header are not enough to reconnect them. Worse, the repeated header gets imported as a regular row inside each table fragment, polluting the data with header text every time the page broke. Cleanup involves merging the table fragments back into one structure and removing the duplicated header rows. Cleanup time: ten to twenty minutes per table per page break.
Type 5 (financial or scientific complex)
Loses the most. Multi-row headers collapse, banded rows reset to plain styling, footnote markers separate from their cells and reattach to the wrong rows or vanish, parenthesized negative numbers sometimes lose the parentheses, decimal-aligned columns lose their alignment. The data may all be present, but the relationships between data points break. For a single complex table, cleanup time runs from forty-five minutes to several hours, and the result still requires verification by someone who knows what the original meant. For multiple Type 5 tables in the same document, cleanup time scales nearly linearly.
Three Fix Paths
Once you have diagnosed the table type, the fix path follows. Three reasonable paths cover almost every situation.
Quick fix in Word, 5 to 15 minutes
Use this for Type 1 tables and short Type 2 tables in documents under twenty pages. Open the converted .docx in Word. For Type 1 tables that look almost right, use Table Tools – Layout – AutoFit to clean up column widths. For Type 2 tables that converted as text, select the text, then choose Insert – Table – Convert Text to Table; specify the separator (usually tab or paragraph), and Word rebuilds the grid. For minor border issues, select the table and apply a clean border style from the Design tab. The text is usually correct; only the wrappers need work.
Tool-assisted workflow, 30 to 60 minutes
Use this for Type 3 and Type 4 tables, or for documents with three or more tables that all need attention. The single conversion from one tool rarely produces a usable result, and the second conversion from a different tool gives you a comparison. Re-convert the PDF in a second tool and open both results side by side. Adobe Acrobat tends to win on Type 3 because its converter recognizes spanning headers more often. ABBYY FineReader wins on Type 4 because its multi-page table tracking is more aggressive. Word’s built-in import wins on simple body flow but loses on every complex table type. Pick the version of each table that came out best, copy it into a new master document, and clean up the remaining failures by hand.
Manual rebuild, when the table matters more than the time
Use this for Type 5 tables in high-stakes documents (financial filings, regulatory submissions, legal exhibits, scientific publications). No converter currently produces a Type 5 table that you can ship without verification, and verification on a complex financial table takes longer than rebuilding it from scratch. Open the original PDF and the new Word document side by side. Build the table structure in Word using Insert – Table with the right number of rows, columns, merges, and banding. Type or paste the data cell by cell. Verify totals, sub-totals, and footnote references against the source. The work is mechanical but unavoidable for documents where one shifted number creates real damage.
The fix paths are not exclusive. A 50-page document with one Type 5 table and several Type 1 tables uses the quick path for the simple ones and the manual rebuild for the complex one. Choose path by table, not by document.
Have a stack of PDFs where the tables fall into Type 3, 4, or 5?
Our team rebuilds complex tables manually – merged cells, multi-row headers, multi-page continuations, financial banding with footnotes, multilingual content with script-specific rules. Faster than a four-hour DIY cleanup, accurate enough for financial, legal, and regulatory use.
When DIY Stops Making Sense
DIY conversion has a clear shape. Inside the shape, free or cheap tools and an hour of cleanup work. Outside the shape, the time you spend fighting tables costs more than a professional service. Four reliable thresholds mark the boundary.
Volume
Above 50 pages of tables, the per-table cleanup time dominates everything else in the project. Twenty minutes per table on a hundred tables is thirty-three hours of work. At any professional hourly rate, sending the job out costs less – and frees you to do the work the conversion was supposed to enable.
Stakes
Financial filings, legal exhibits, regulatory submissions, audit reports. Documents where one mismatched number, one shifted decimal point, or one lost footnote reference causes real damage. The accuracy bar here is not 95 percent but 100 percent, and the cost of mistakes runs asymmetrically. DIY tools rarely meet the bar without exhaustive QA, which itself takes longer than a professional rebuild.
Multilingual content
Tables that mix Latin, Cyrillic, Arabic, Hebrew, or CJK scripts on the same pages need a different discipline. Most converters handle one language well and the rest poorly. Right-to-left scripts in tables cause column-direction issues that automated tools rarely catch. Our team handles document conversion across 50+ languages, including right-to-left and CJK scripts, with script-specific rules for column direction, footnote placement, and decimal handling.
Complex layouts that fight every converter
Documents that combine all five table types in the same file: simple grids next to borderless reference tables next to complex financial summaries with merged headers, banded rows, and footnoted cells. We see this regularly with annual reports, scientific journal articles, and regulatory filings. A skilled human rebuilds them faster than any combination of tools can match the original.
The rough math: if your converted file would need four or more hours of cleanup before the tables match the source, professional conversion almost always costs less than your time. None of this means DIY tools are useless. They handle Type 1 tables at full fidelity and most Type 2 tables with reasonable cleanup. Reading the file before reaching for a tool remains the discipline that saves time.
Frequently Asked Questions
Why do tables collapse into plain text when I convert PDF to Word?
The PDF did not store the table as a structured object. It drew lines on a page and placed text between them, leaving the converter to infer the grid. When the lines are missing, faint, or interrupted, the inference fails and the converter outputs the cell contents as a flow of text separated by tabs or spaces. Borderless tables and tables that rely on banding fail this way most often. The fix: select the text in Word and use Insert – Table – Convert Text to Table to rebuild the grid manually.
Which tool best preserves merged cells when I convert PDF with tables to Word?
None preserves them reliably across every document. Adobe Acrobat handles merges in PDFs that Adobe products generated more often than other tools, because the merge metadata sometimes survives in the PDF itself. ABBYY FineReader’s manual table-area tool lets you draw the merge boundaries and re-run recognition, which works when automated detection fails. For high-stakes merged-cell tables, professional manual reconstruction is faster than fighting any tool.
How do I keep multi-row headers intact in conversion?
Multi-row headers fail in two distinct ways. First, the rows separate – the top header row converts as one, the second header row converts as another, and the link between them breaks. Second, spanning cells in the top row collapse into a single cell, taking the hierarchical meaning with them. The reliable fix is manual: rebuild the header structure in Word using Insert – Table, then merge cells in the top row to match the original. For frequent multi-row header documents, ABBYY FineReader’s manual table-area workflow handles this case better than fully automated tools.
Can I convert PDF tables to Word and keep formulas?
No. PDFs do not store formulas; they store the rendered values that the formulas produced. Conversion to Word delivers the values as plain numbers in cells. If you need formulas, the source is not the PDF – it is the original spreadsheet that produced the PDF. Ask the document owner for the source .xlsx file. If the source is gone, you have to rebuild the formulas manually after conversion, which is feasible only when you understand what the formulas were supposed to do.
Why do numbers misalign in columns after conversion?
PDFs render numbers using fixed character positions. Decimal points and currency symbols line up because the renderer placed them at specific coordinates. Word handles alignment differently, using paragraph properties applied to each cell. The converter sees the visual alignment but does not always preserve the underlying alignment property; it leaves the numbers in their cells but renders them with default left alignment, breaking the visual line-up. The fix in Word: select the column, open Paragraph properties, set alignment to right or use a decimal tab stop.
How do I handle multi-page tables that span page breaks?
Most converters treat each page of a multi-page table as a separate table. Repeated header rows from page two and beyond import as regular data rows, polluting the table content. The fix is mechanical: in Word, identify the table fragments that belong to the same original table, delete the duplicate header rows from each continuation, then merge the fragments using Table – Merge or by copy-paste from the second fragment into the first. ABBYY FineReader handles multi-page detection more aggressively than most tools, but verification is still required.
Should I convert PDF tables to Word or to Excel?
Depends on what you plan to do with them. Word handles tables embedded in flowing prose well, with cross-references, captions, and surrounding context preserved. Excel handles tables as data, with formulas, sorting, filtering, and charts available. If the table is the centerpiece (financial schedules, scientific data, comparison matrices), Excel usually fits better. If the table is one element among many in a longer document (a report with text, headings, and tables), Word fits better. Adobe Acrobat lets you export to either format from the same source PDF.
When should I just hire someone to do this conversion for me?
When the math no longer adds up. Above 50 pages of complex tables, multilingual content, or stakes-heavy documents (financial, regulatory, legal), a professional service costs less than the hours you would spend cleaning up. The break-even point sits at roughly four hours of expected manual fix time. Below that, DIY usually wins. Above it, send it out. The break-even calculation is honest: count the tables, classify them by type, estimate cleanup time per table from the ranges in this guide, and compare the total to a professional quote.
“Convert PDF with tables to Word without losing structure” is a half-true promise. No conversion runs loss-free on complex tables, but every table type has a predictable failure profile that you can plan for. Diagnose the type, pick the fix path, budget realistic cleanup time, and check the math before you commit. When the math says professional, send it out. The clients who never run the math are the ones who lose the most hours.