TASAI Annual Reports

Flagship data-heavy reports for TASAI – 200+ pages per edition, 17 indicators across 47 countries, every chart rebuilt as vector graphics.
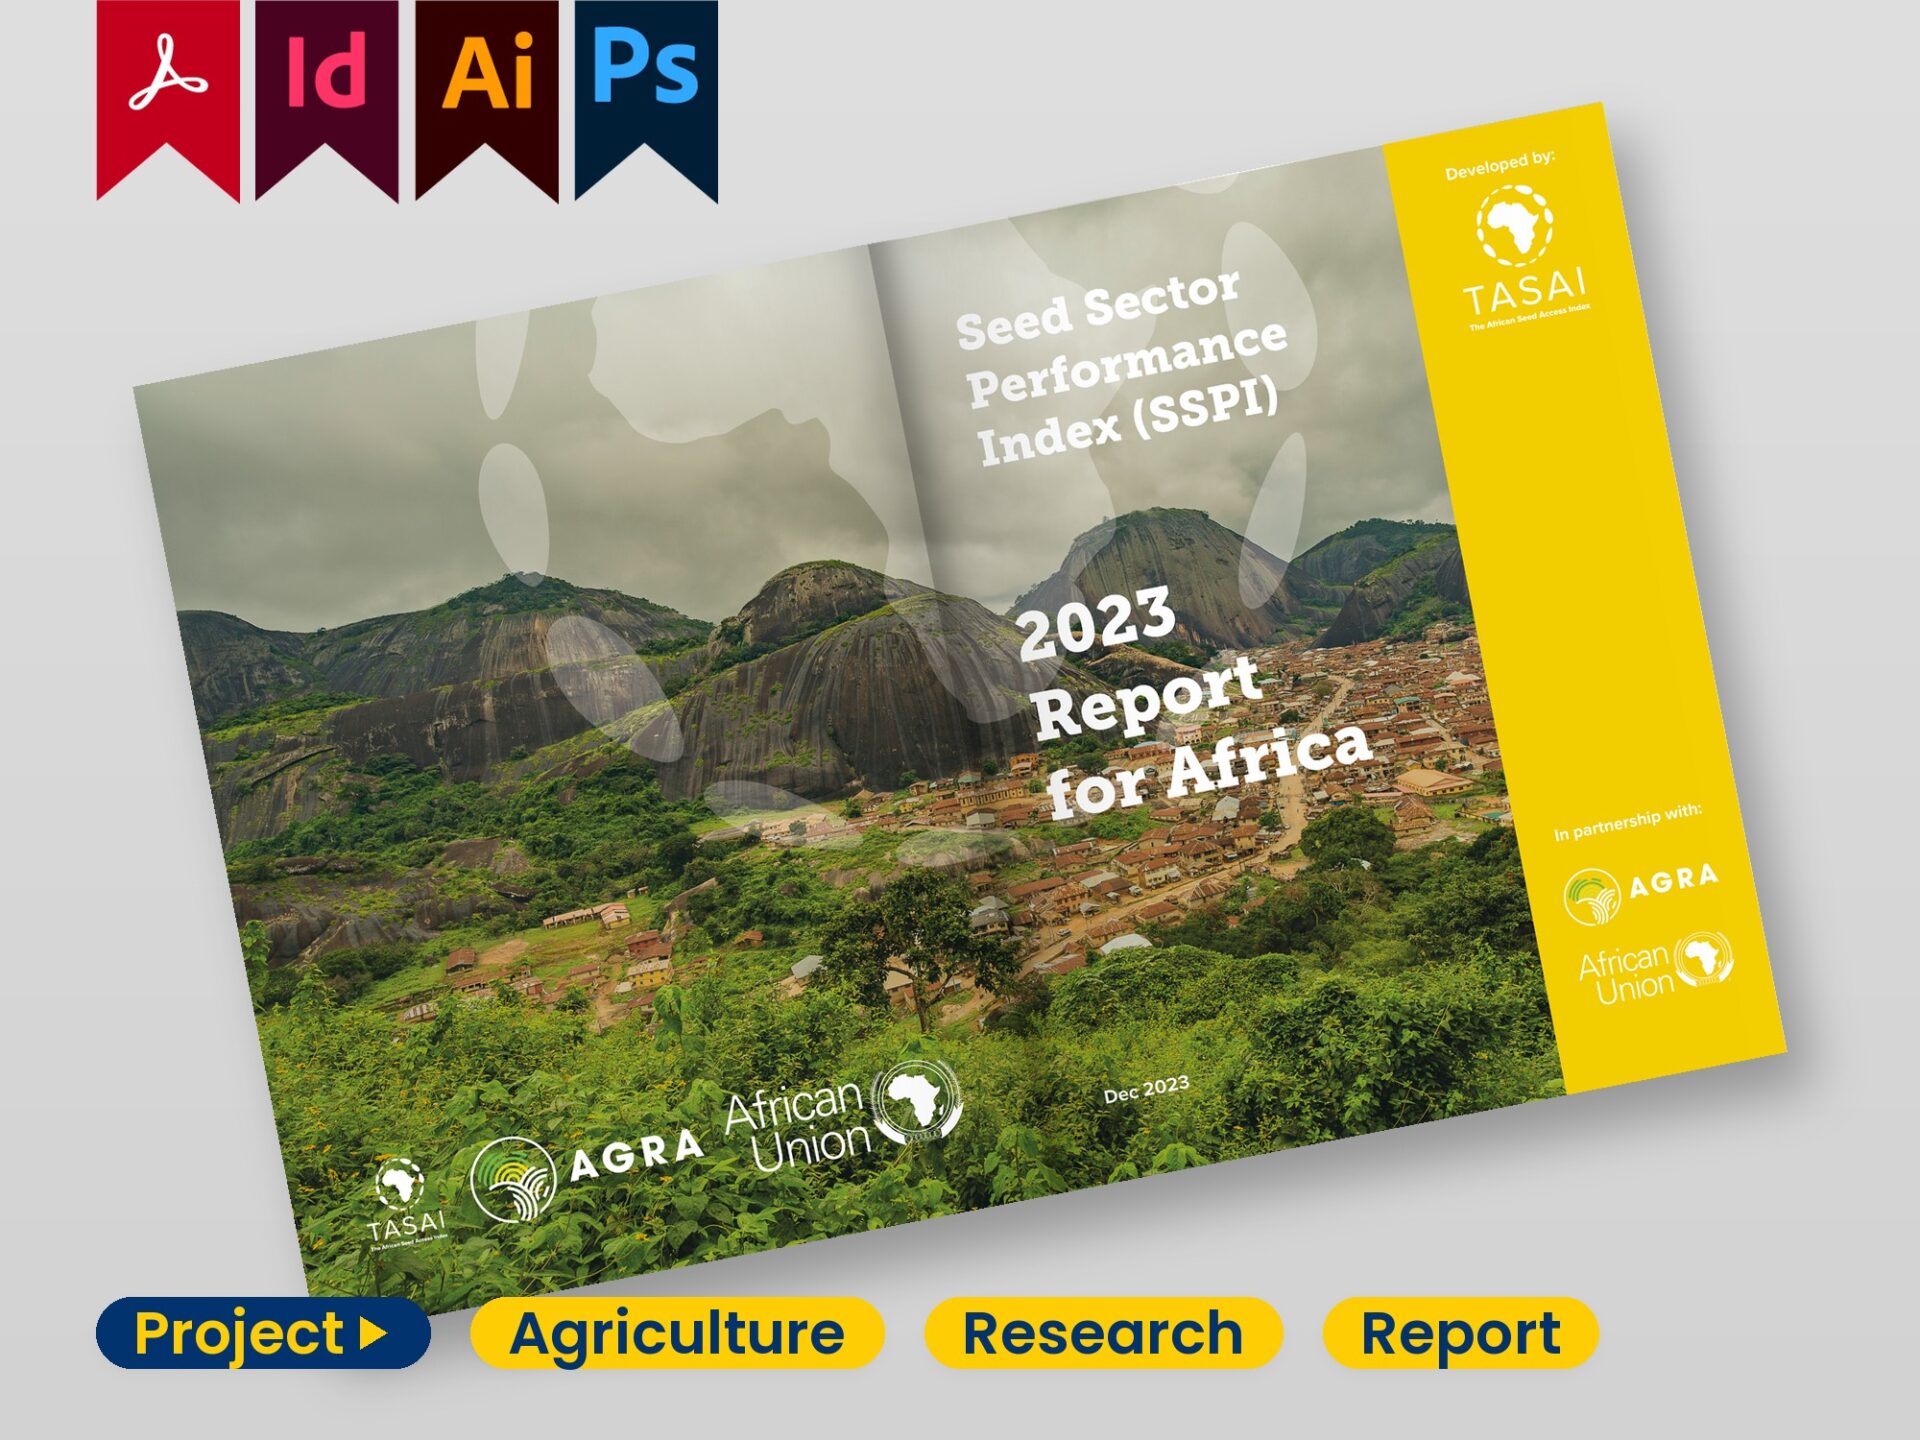
Front-and-back cover spread of the TASAI annual seed-sector report, designed in InDesign
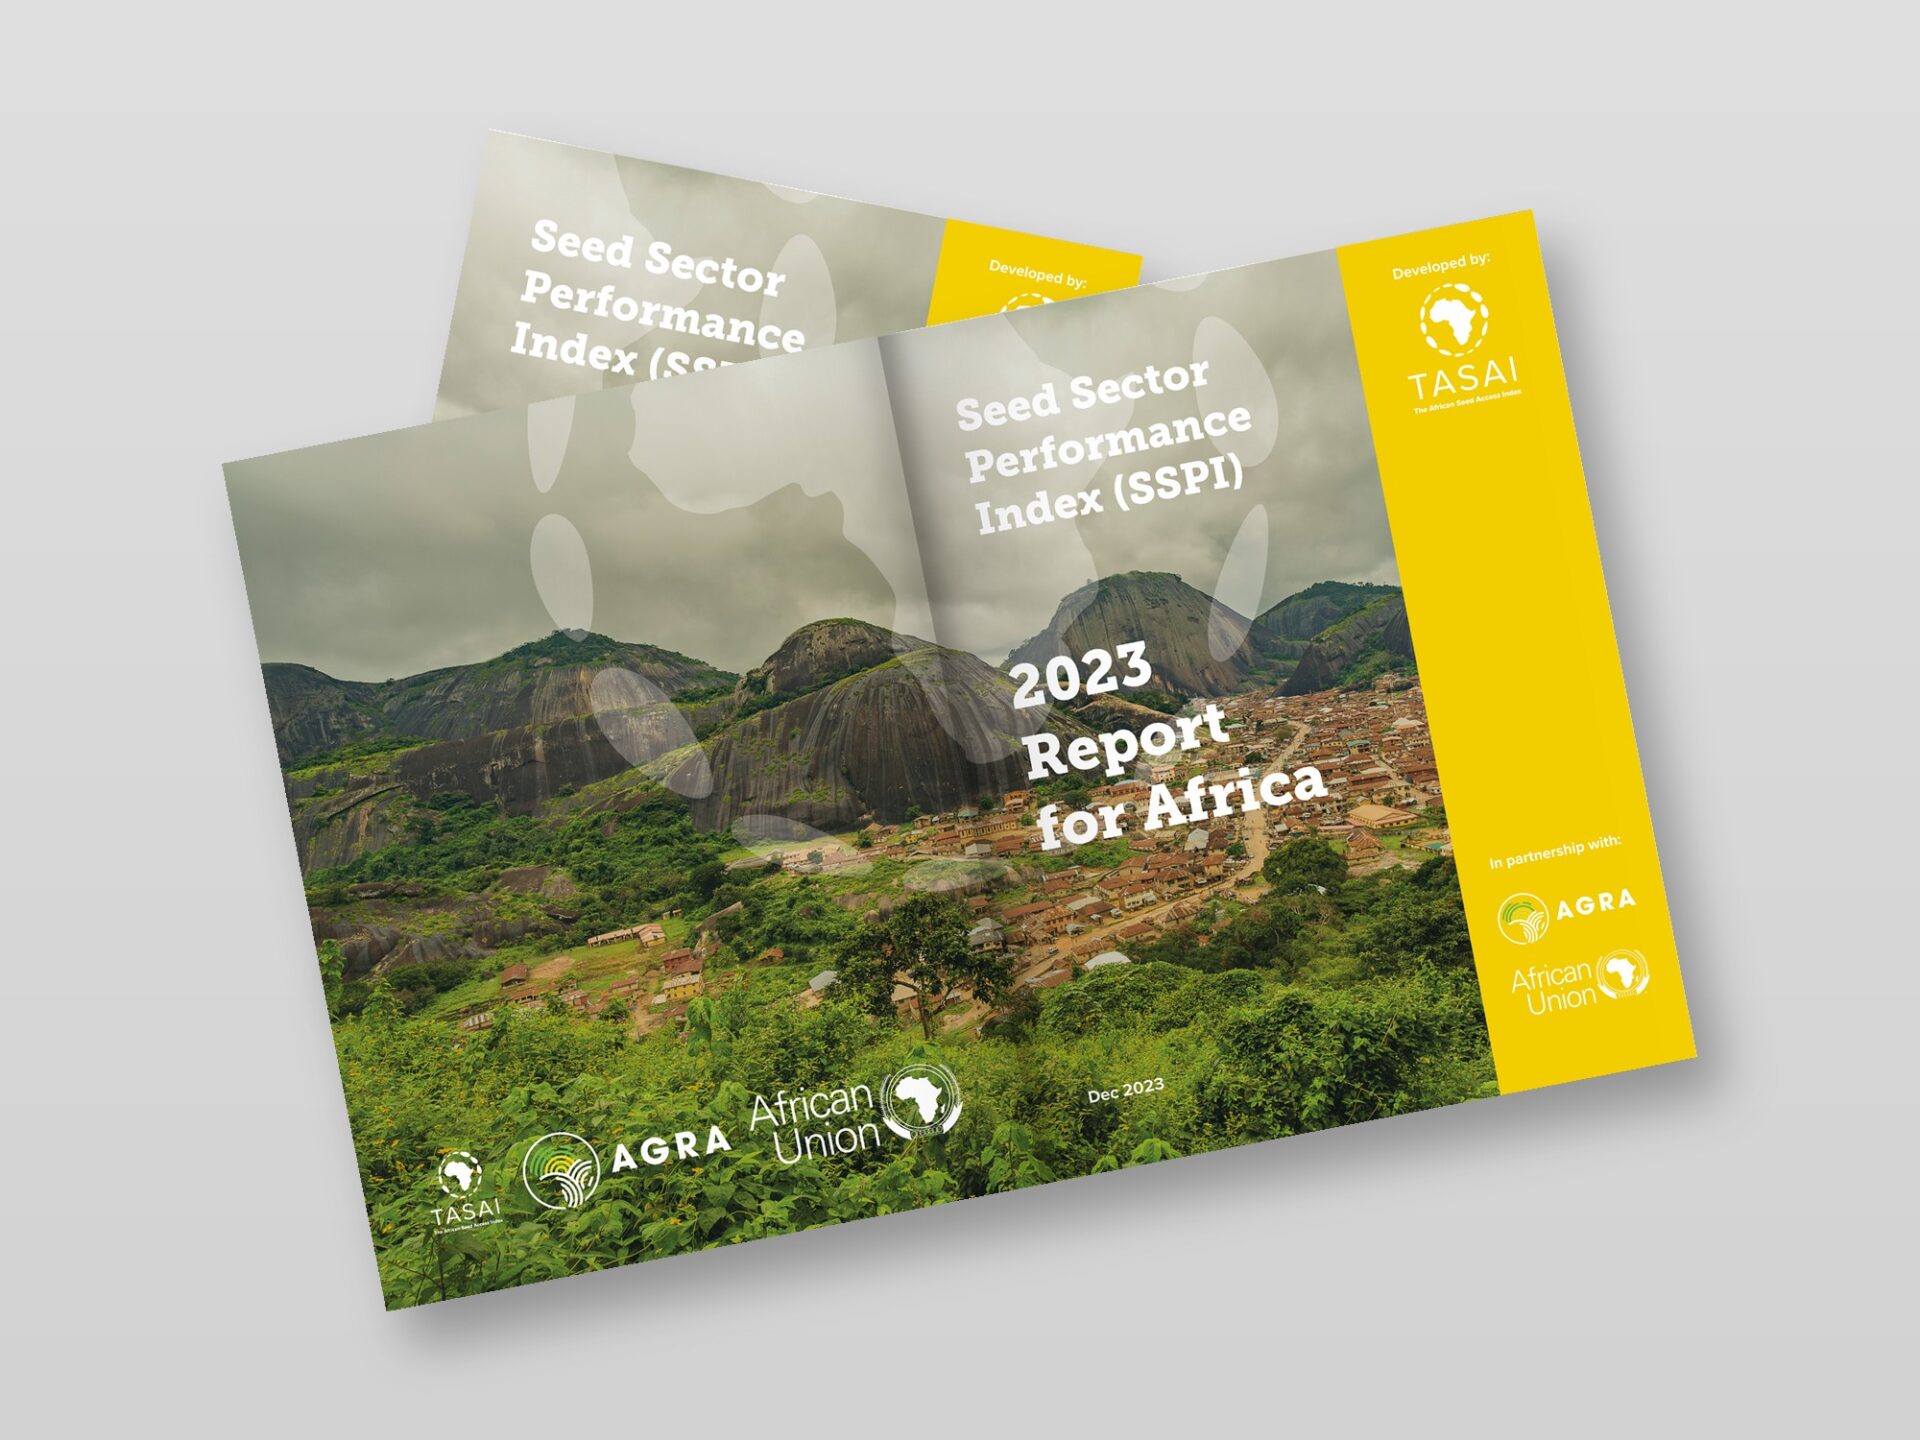
A stack of successive annual editions, showing the consistent cover system across the series
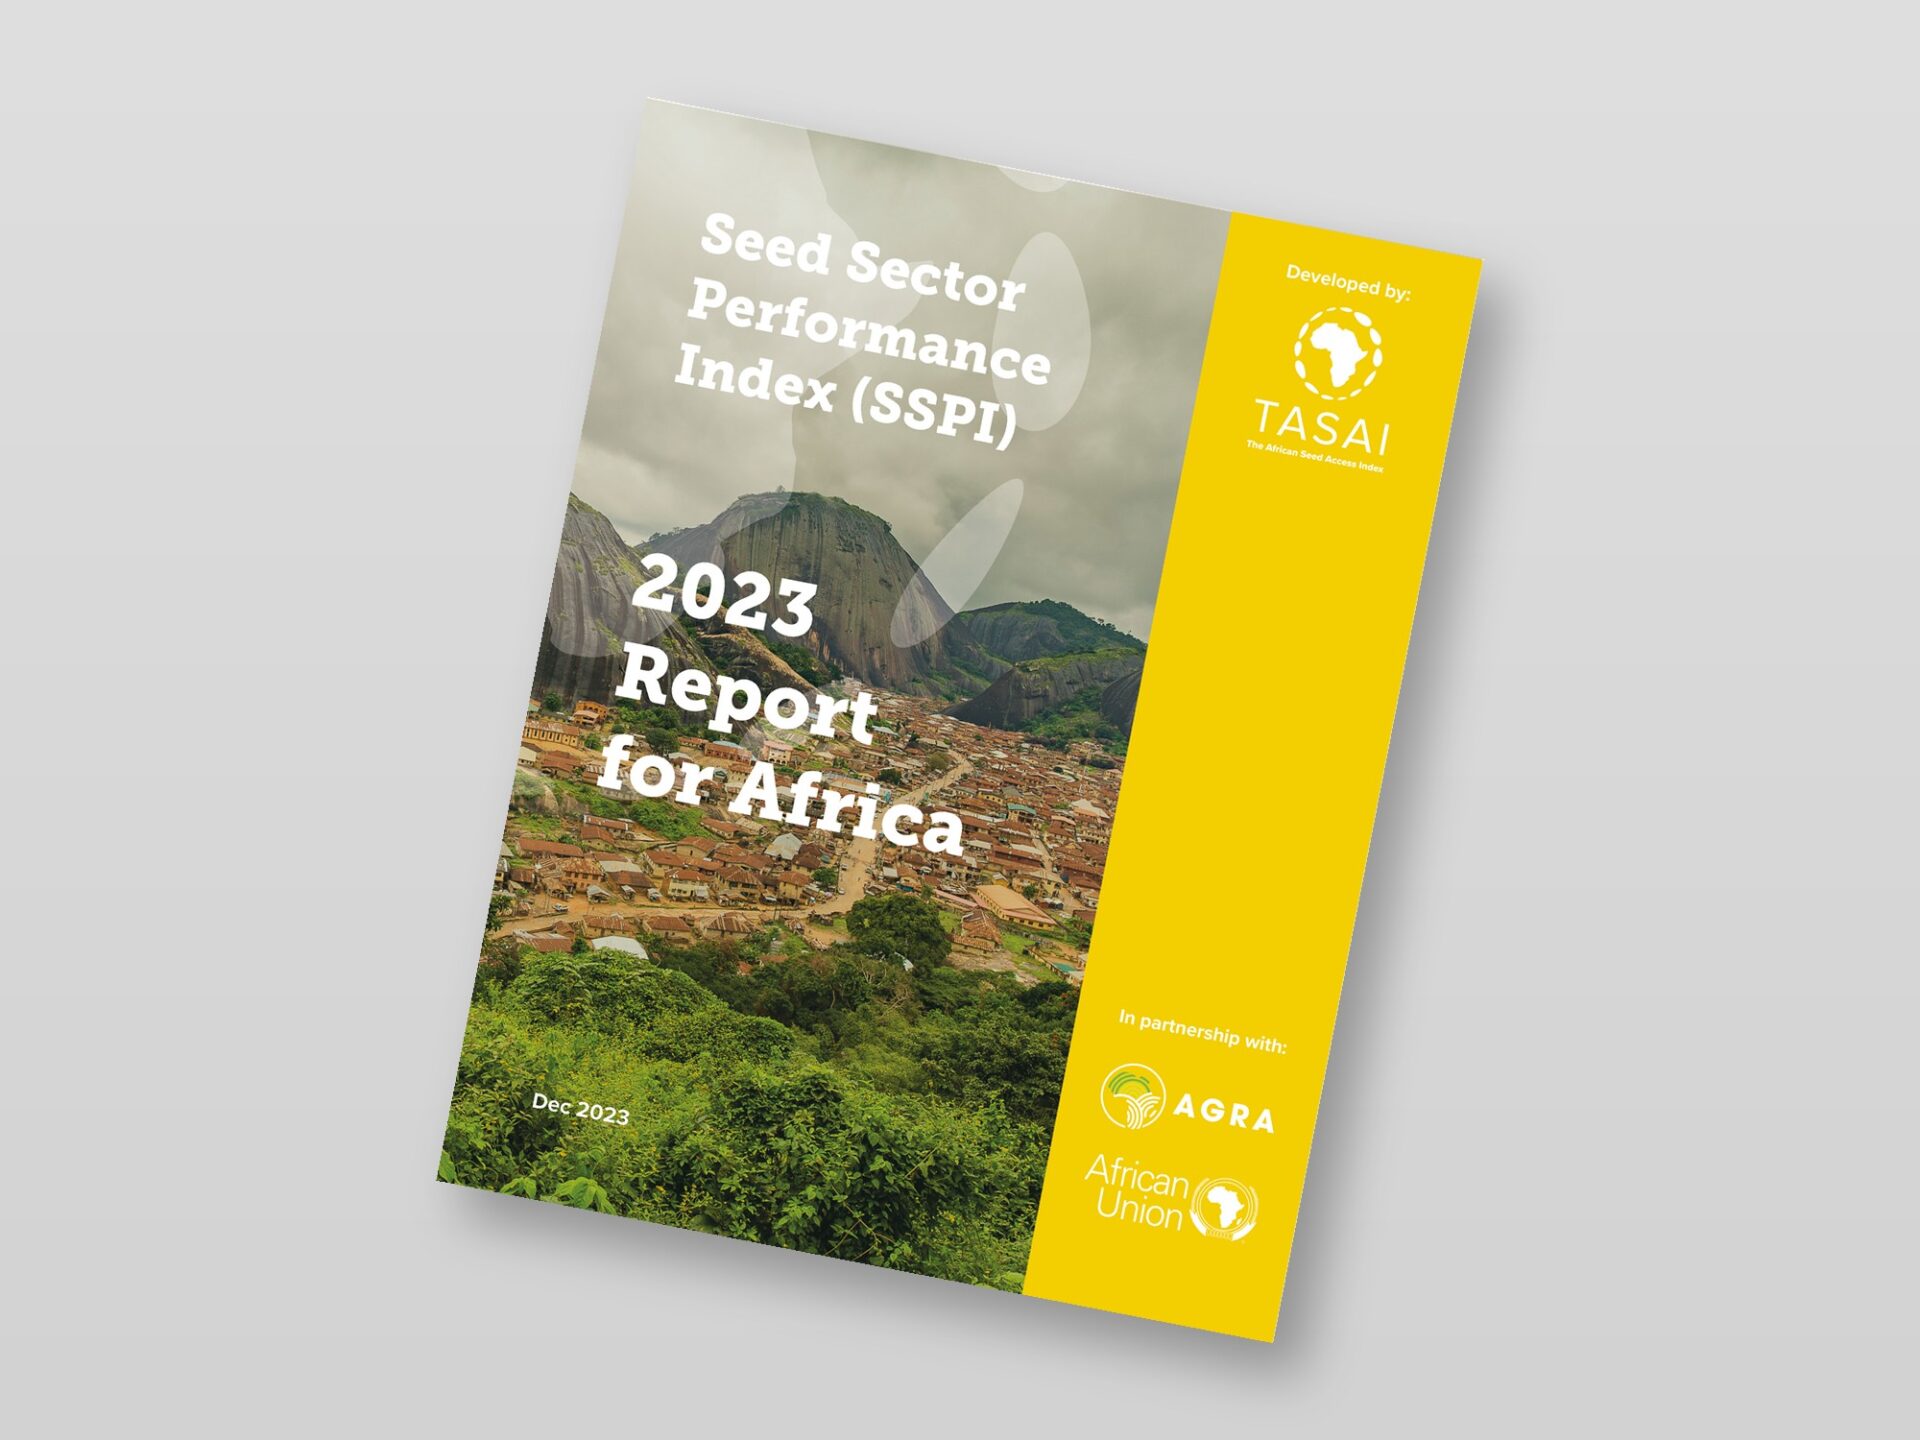
Single cover – full-bleed photography, color sidebar with partner logos, bold title block
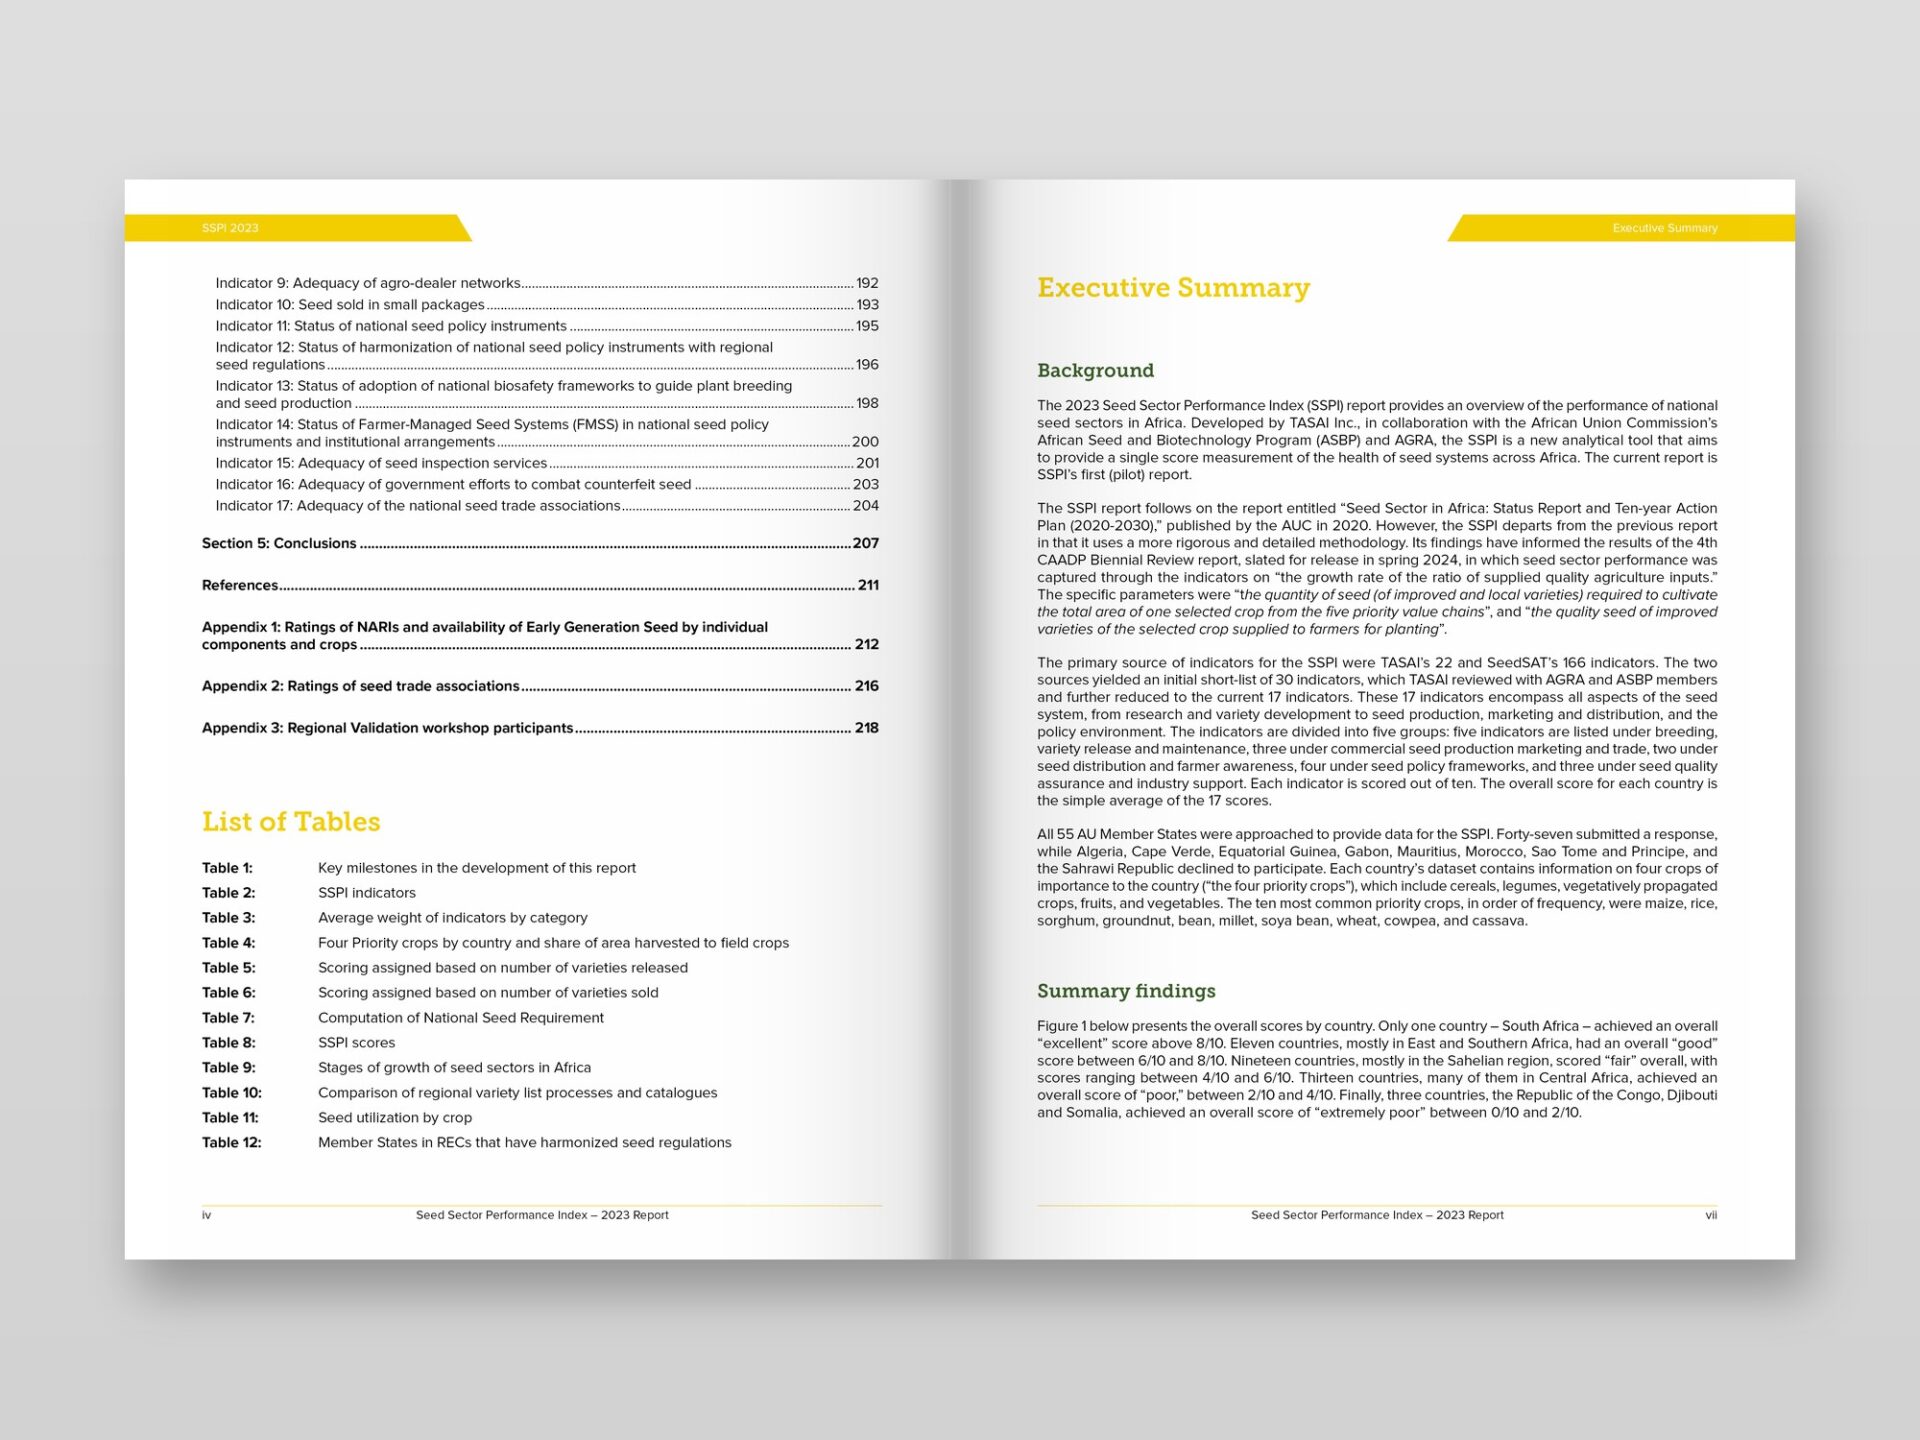
Table of contents and executive summary on a disciplined editorial grid
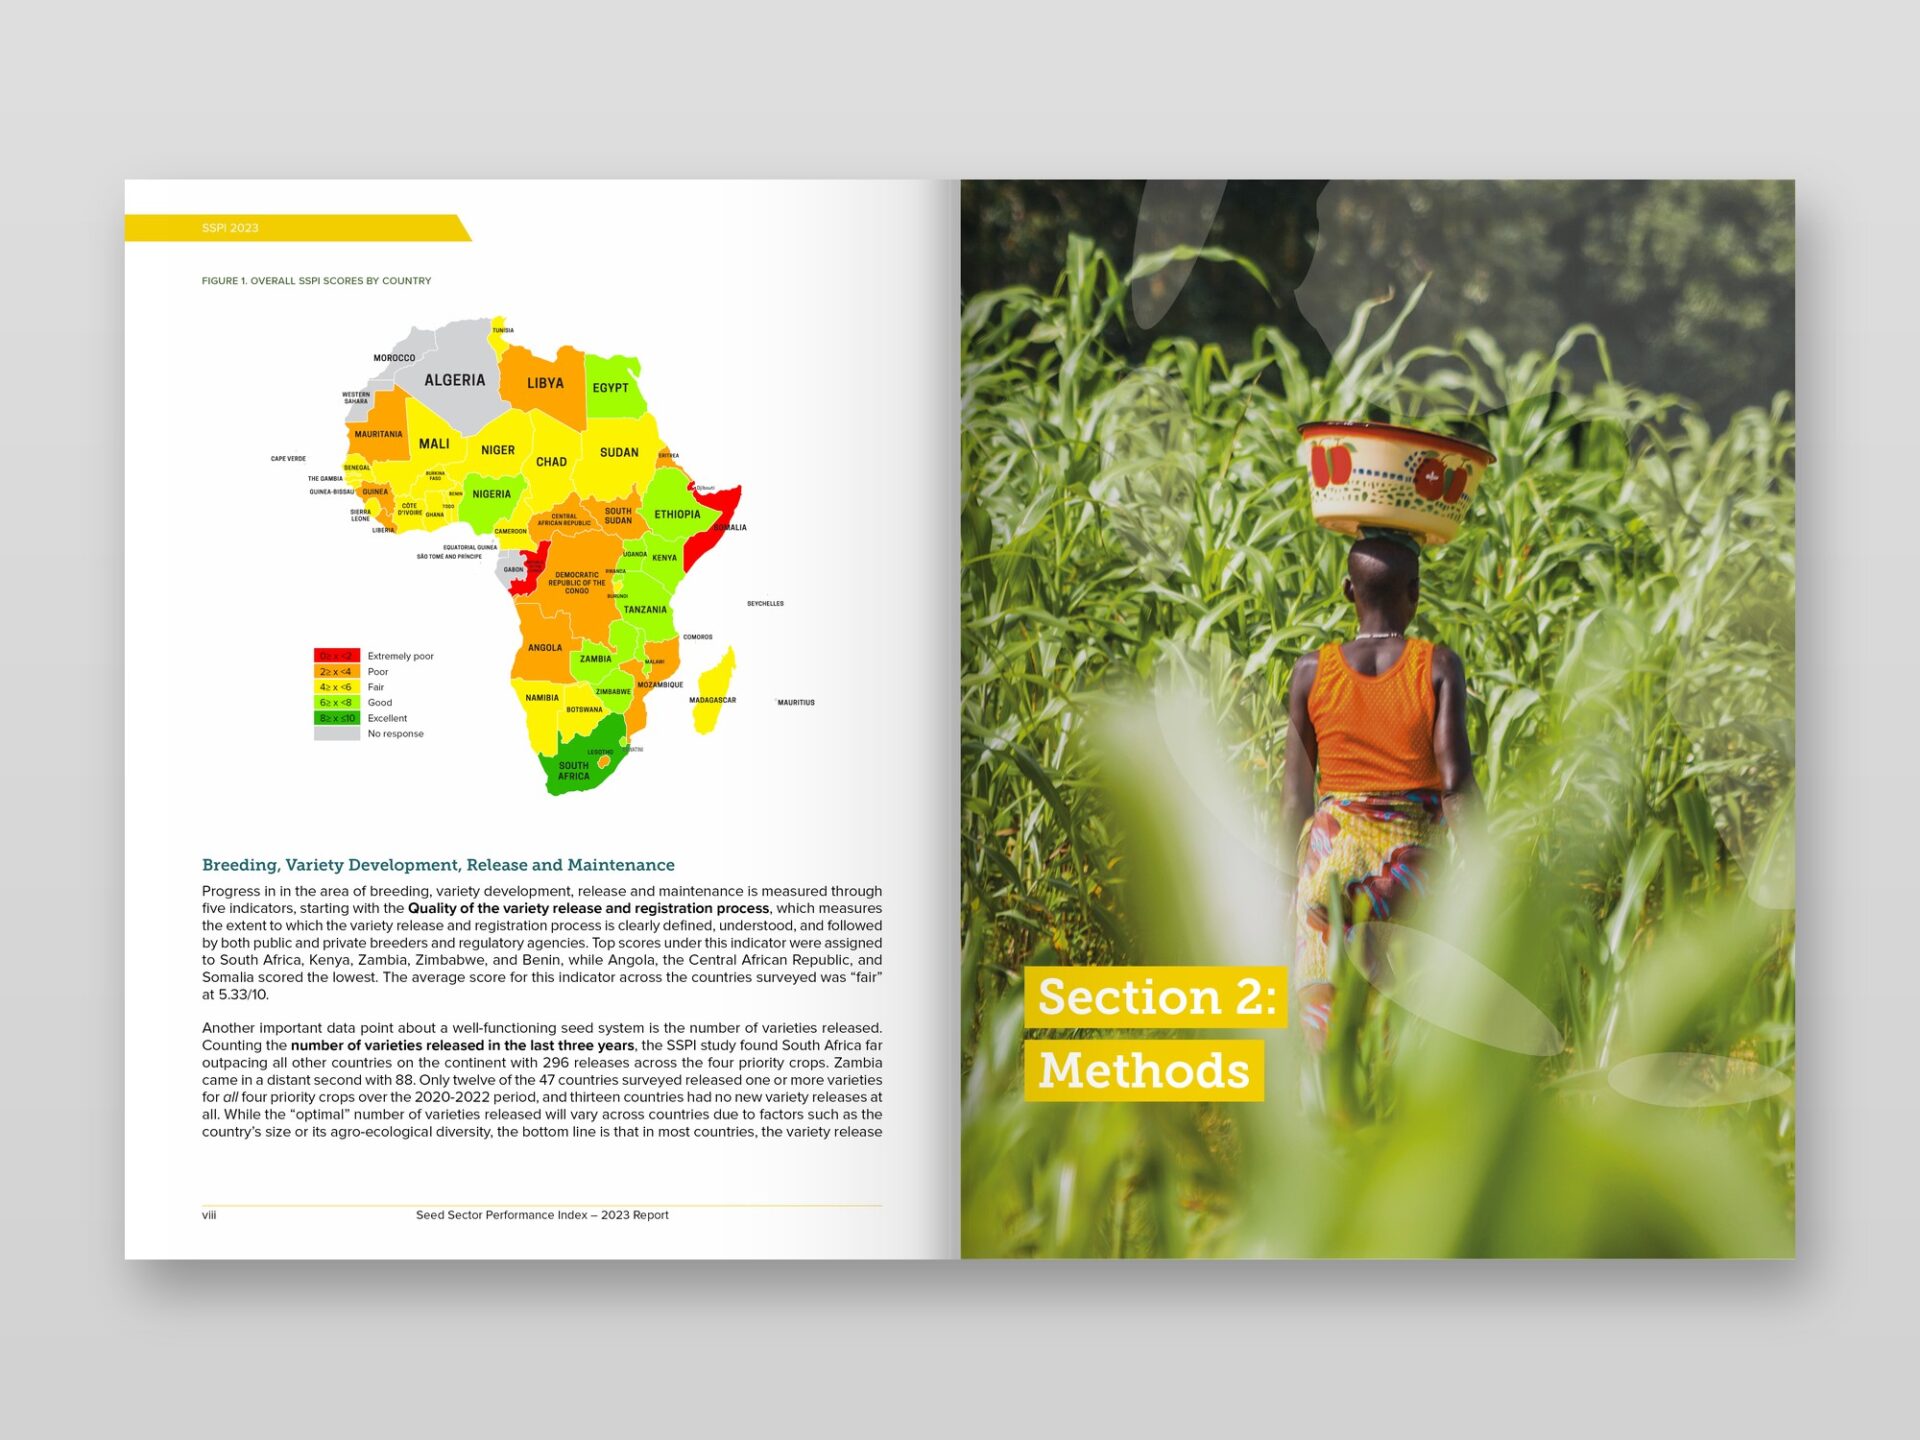
Choropleth map and full-bleed section divider rebuilt as scalable vector graphics
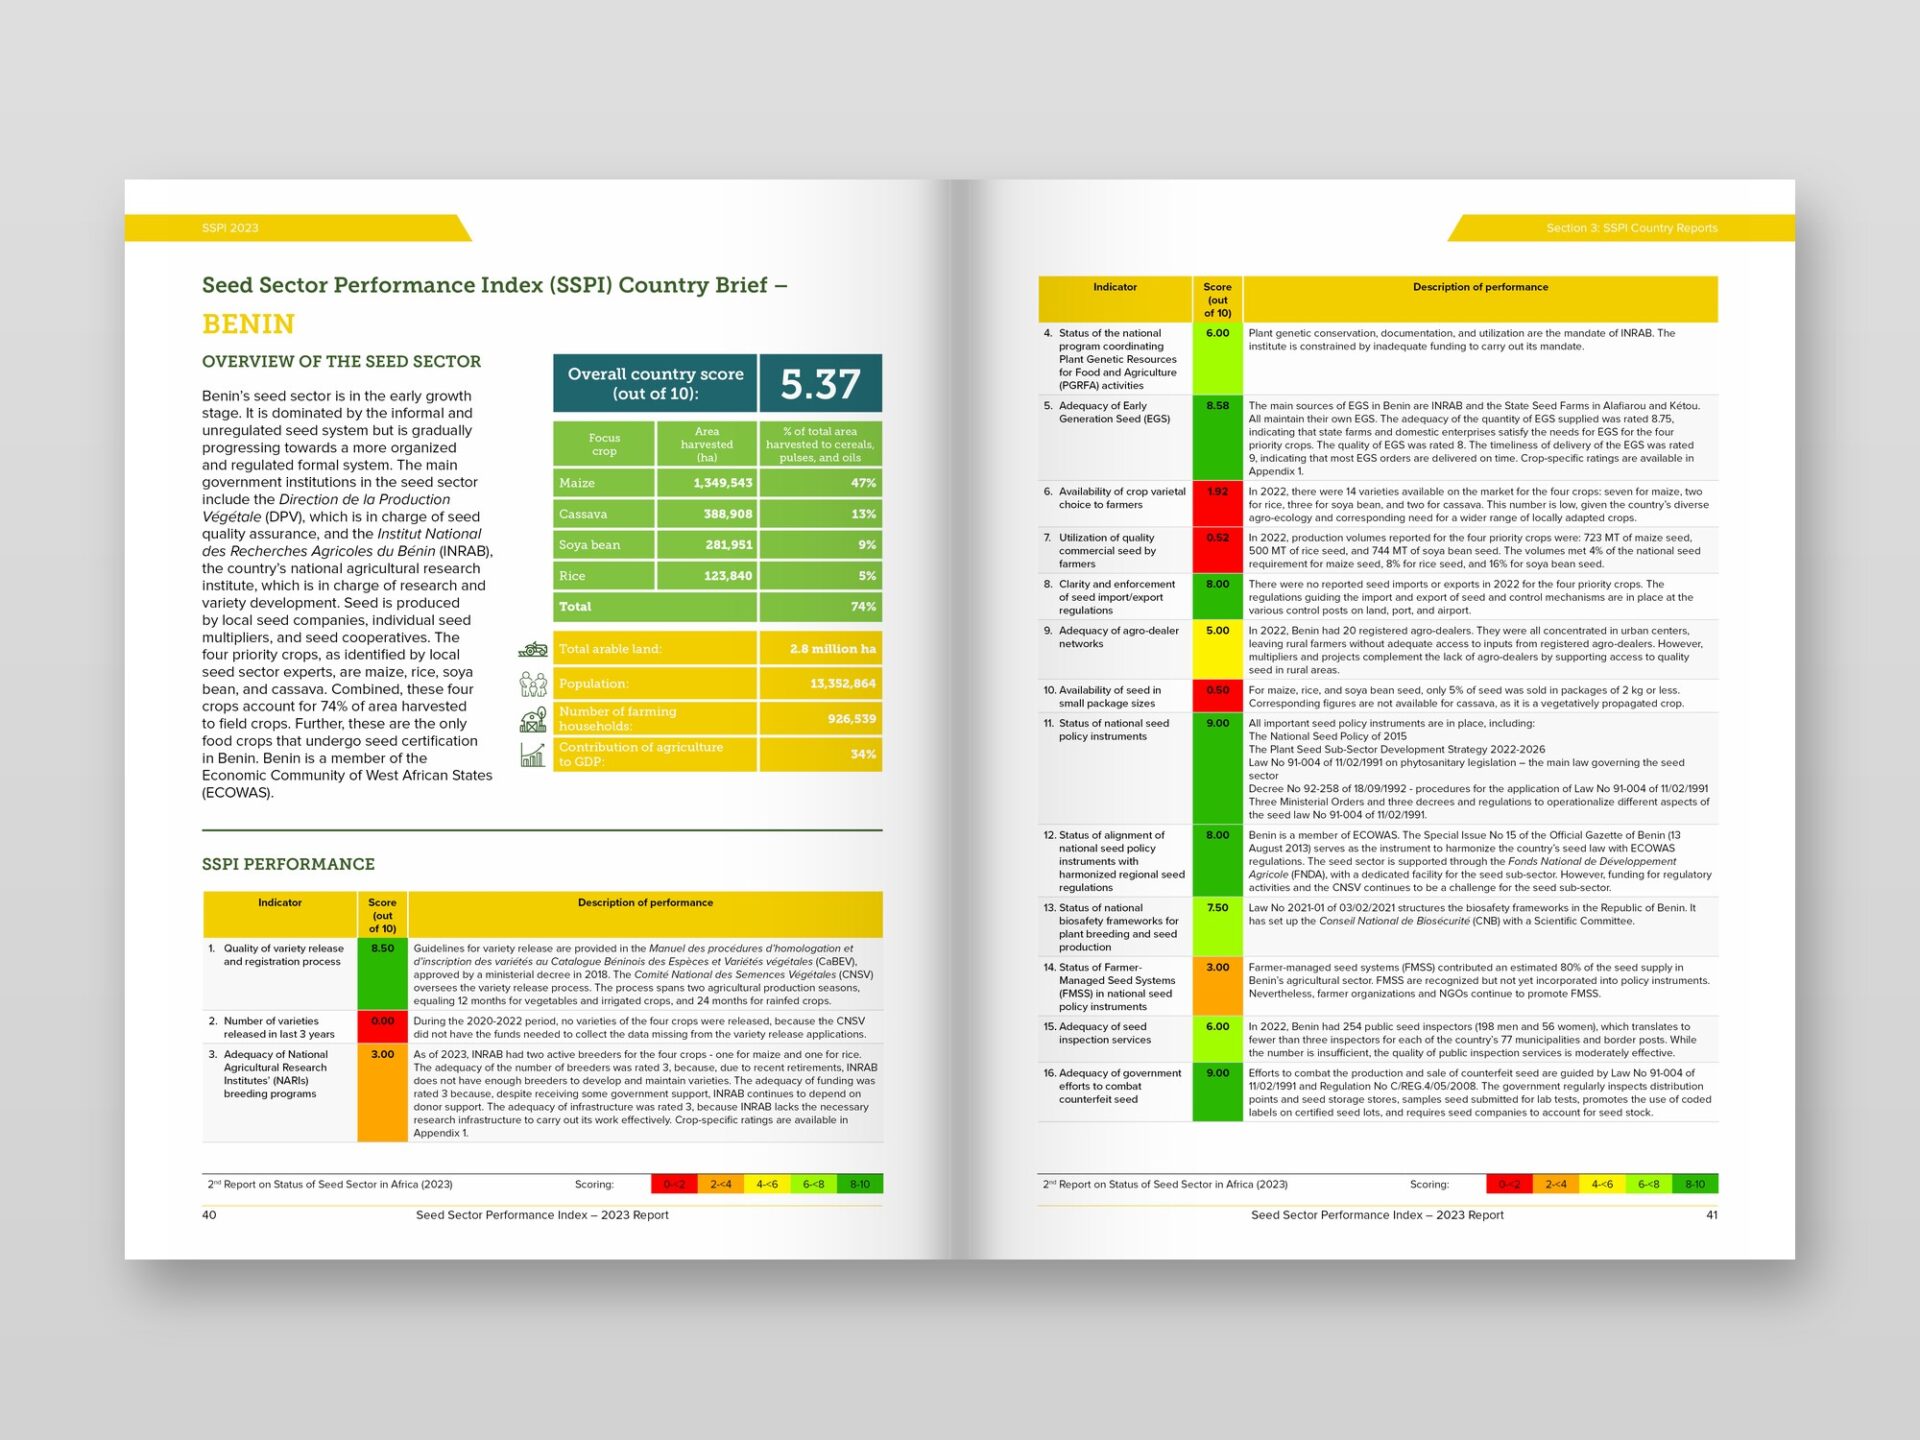
Benin country-brief page – color-coded score tables and snapshot panels from the modular template
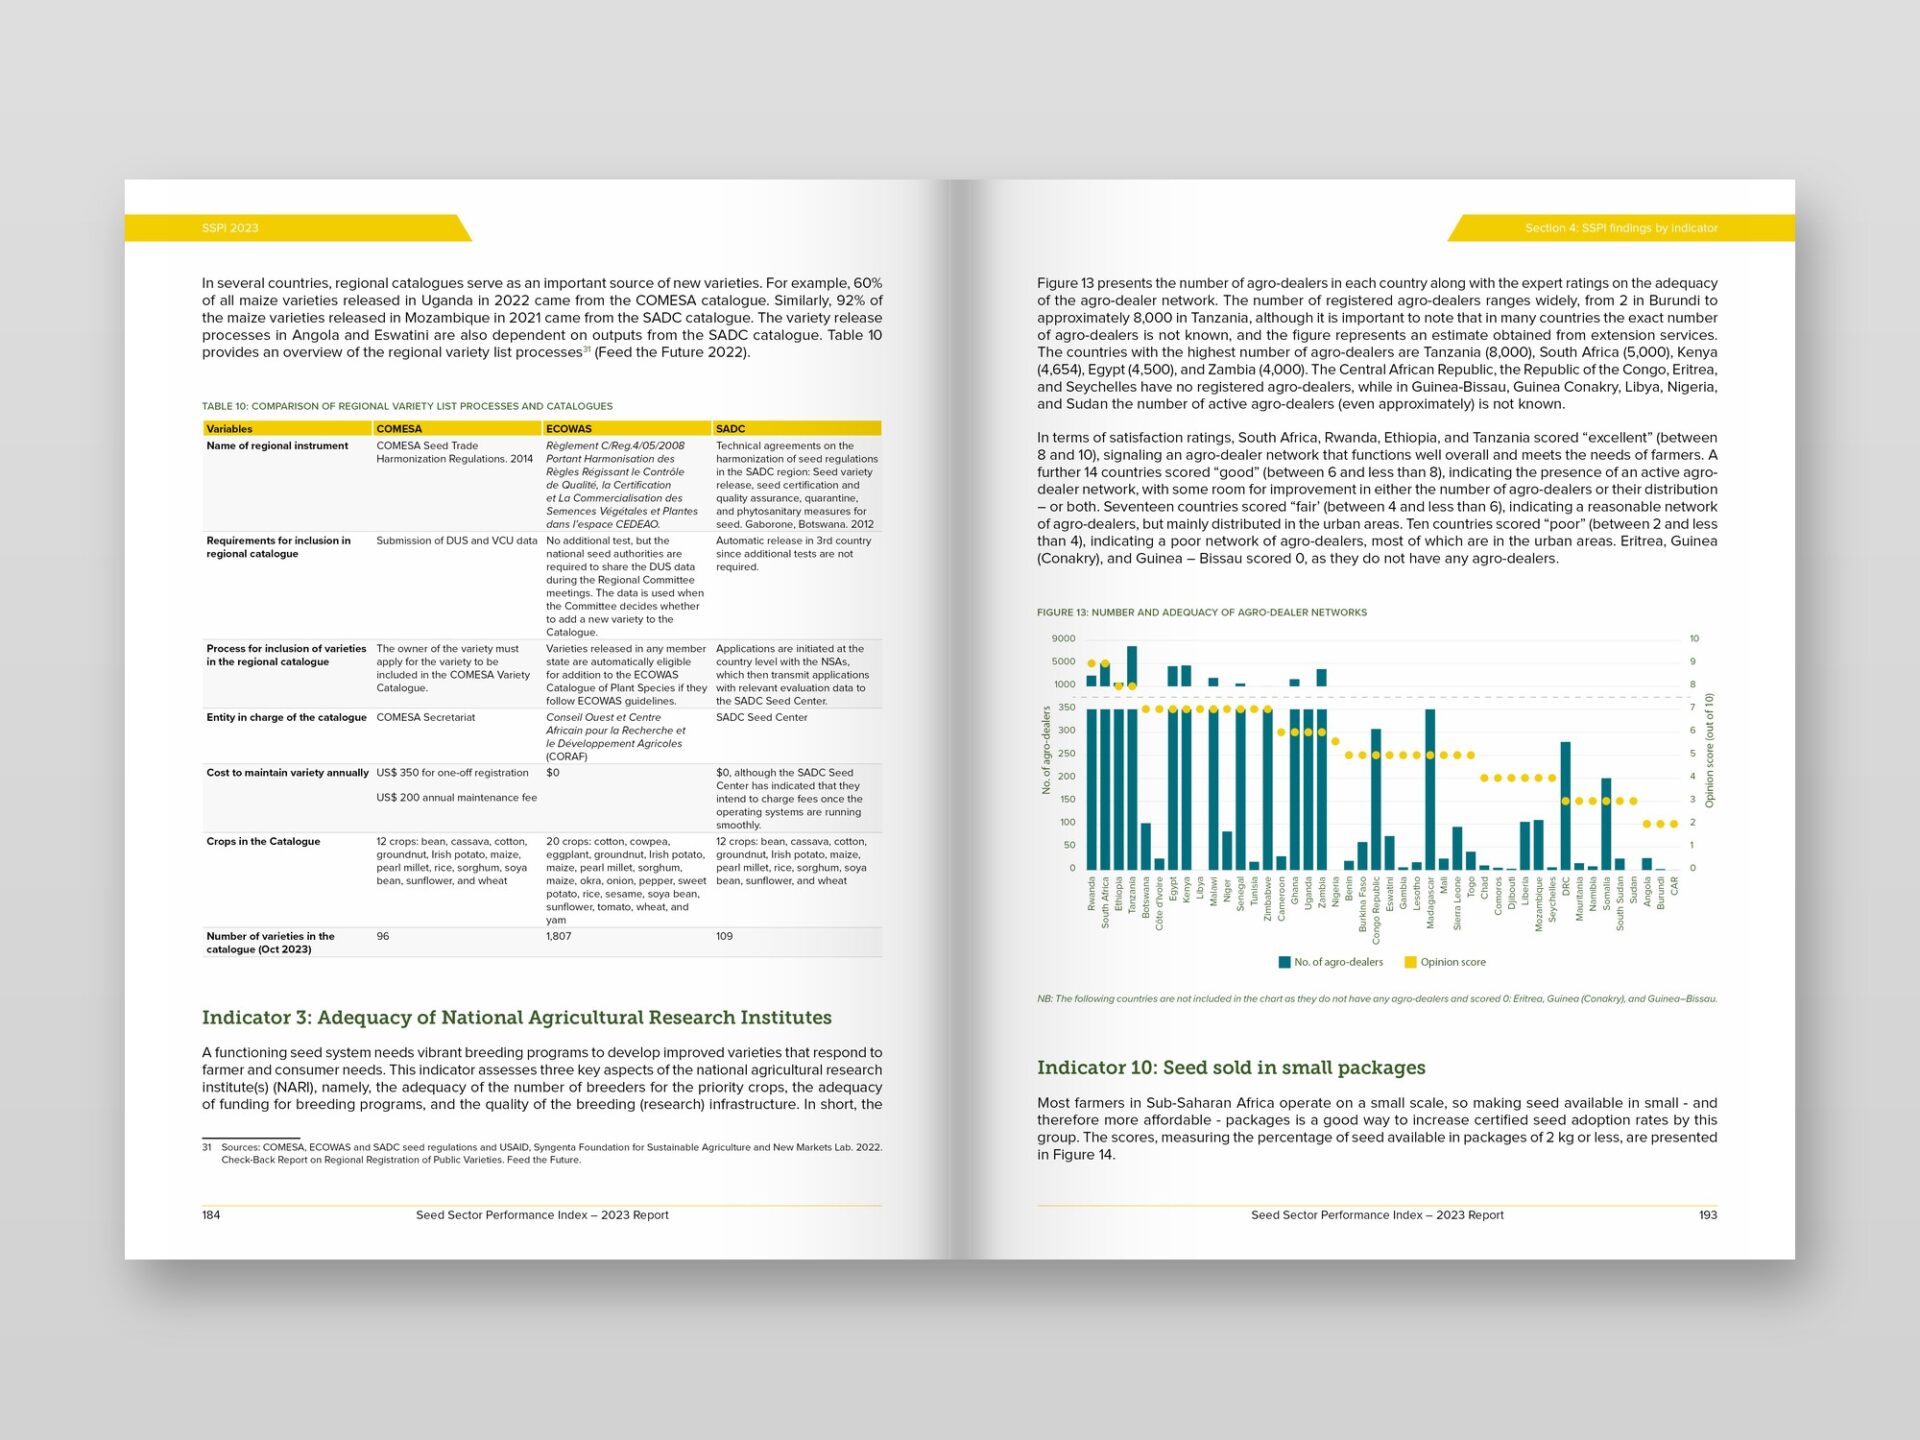
Data-heavy spread with custom vector charts, part of a 200+ page print- and web-ready report

About the Client

TASAI (The African Seed Access Index) benchmarks the health of seed sectors across Africa, working with the African Union Commission and AGRA to guide governments and public programs.

Challenge & Solution

TASAI needed its flagship Seed Sector Performance Index reports built from raw manuscripts into publication-ready files. As their ongoing DTP partner across successive annual editions, our team delivers the full build:

  • Cover and back-cover design
  • Inner-page layout of all supplied text on a disciplined editorial grid
  • Every chart, map, and table rebuilt as scalable vector graphics in Illustrator
  • Print-ready CMYK and web/interactive outputs from a single source

Built as a System

A recognizable cover system anchors every edition – full-bleed photography, a signature color sidebar with partner logos, and a bold typographic title block. Inside, a modular template renders the same 17 indicators for every nation – color-coded score tables, country-snapshot panels, and performance summaries applied consistently across 47 country profiles.

Client Benefits

  • One partner from raw text to publication-ready files, edition after edition
  • Consistent identity across covers, dividers, and 200+ inner pages
  • Complex seed-sector data made clear through custom vector charts and maps
  • Editable InDesign packages for fast updates and future editions
  • Dual print + web/interactive delivery for public distribution

Results & Deliverables

  • Successive annual SSPI editions delivered from raw manuscript to publication
  • 200+ pages per edition – 17 indicators across 47 African Union member states
  • 25 charts, maps, and tables rebuilt as scalable vector graphics in the latest edition
  • Print-ready CMYK and web/interactive PDFs from a single source

Related services: Document Design · Multilingual DTP

Need work built to this standard?

Tell us about your project – files, languages, deadline – and we will reply with a clear quote within one business day.

Get a Free Quote · Contact Us

Client:
TASAI Inc
Year:
2024
Tools:
InDesign · Illustrator
Volume:
200+ pp · 47 countries
Timeline:
Ongoing annual editions
WE AREe-Doc Ltd
Have a question or project?

Email us – we reply within one business day.
OUR HOURSWe Are Open
Mon – Fri: 09:00 – 18:00 EET

Sat – Sun: Closed

Response: within one business day


Outside these hours – available on request when a team member is free.

OUR OFFICEFrom Ukraine, for the World
https://ebook.ltd/wpcontent/uploads/2019/04/imgfootermap.png
OUR SOCIALSLet’s Stay in Touch
Join our network to get tips, updates, and behind-the-scenes stories.
WE AREe-Doc Ltd
Have a question or project?

Email us – we reply within one business day.
OUR HOURSWe Are Open
Mon – Fri: 09:00 – 18:00 EET

Sat – Sun: Closed

Response: within one business day


Outside these hours – available on request when a team member is free.

OUR OFFICEFrom Ukraine, for the World
https://ebook.ltd/wpcontent/uploads/2019/04/imgfootermap.png
OUR SOCIALSLet’s Stay in Touch
Join our network to get tips, updates, and behind-the-scenes stories.

© 2026 Private Entrepreneur Yevhen Ivaniv, trading as e-Doc Ltd.
All rights reserved.

© 2026 Private Entrepreneur Yevhen Ivaniv, trading as e-Doc Ltd.
All rights reserved.